
Admin Dashboard & statistics
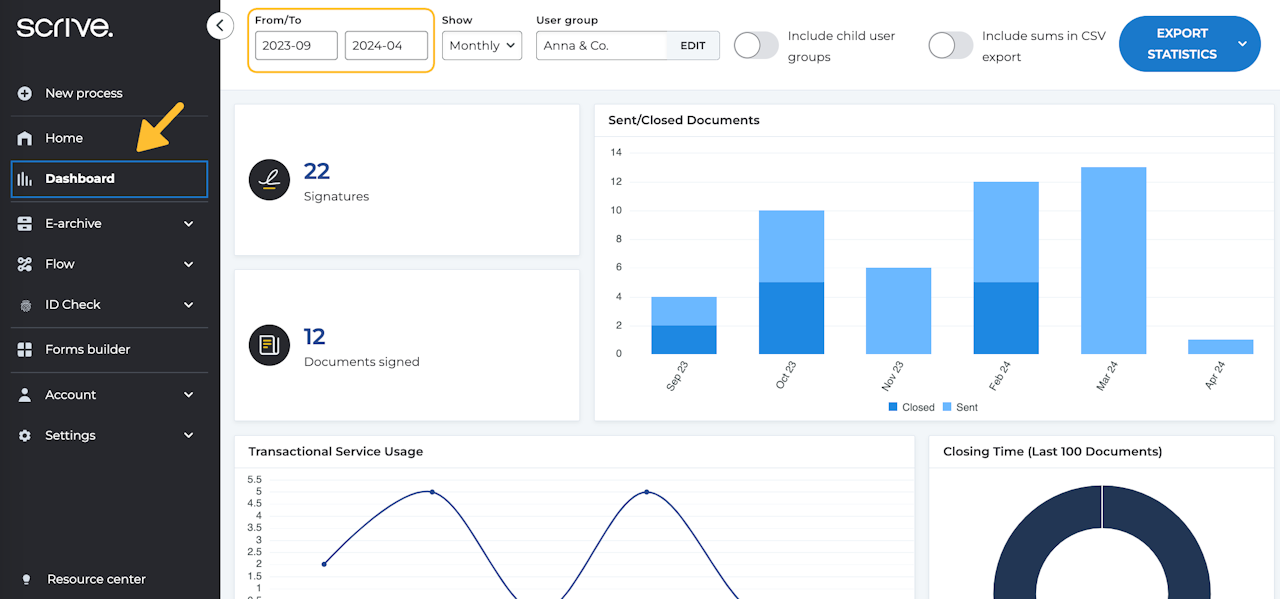
Standard users and Account admins can easily view their individual statistics. However, as a user with an Admin role, you're granted a comprehensive overview of your entire user group's activities. To explore these insights, simply head over to the 'Dashboard' page via the main menu.
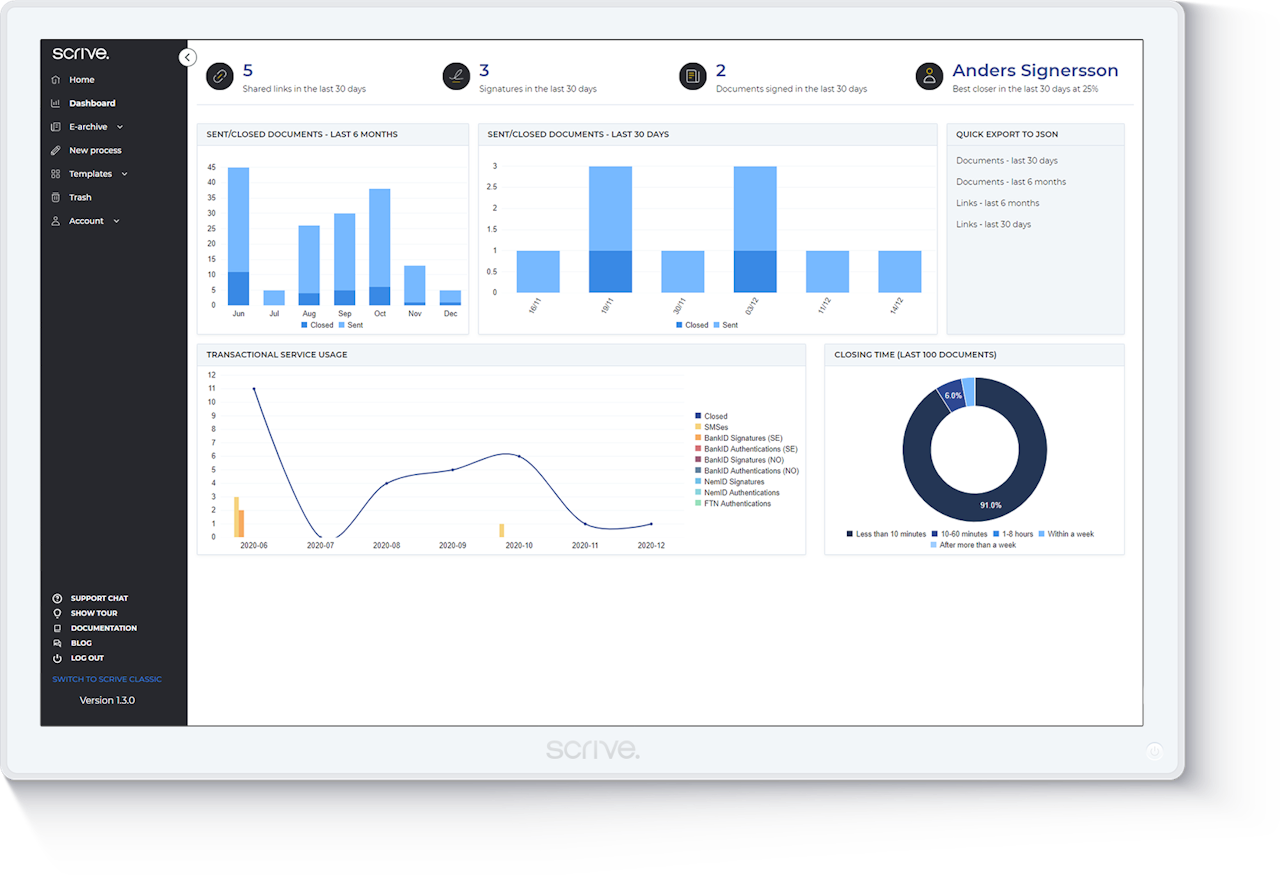
You can gain insights into the organisation's overall activity and individual user performance for sent and signed documents
For Enterprise price plan Admin users, you can also delve deeper, exploring statistics specific to each user group
Scroll down to learn more ⤵

Navigating the Dashboard for Admin users
You can access the Dashboard through the main menu on your left. Tailor your view by selecting a specific time period using the settings at the top of the page.
You can view up to 12 months of data. For daily statistics, data is available for a timespan of 30 days or less. If you extend your search beyond this period, statistics will be presented in a monthly summary.
Hover your mouse over the various graphs for more detailed information. For both daily and monthly statistics, you can click on any data point to view further details.

Export Dashboard statistics
In the Dashboard, you can easily access and export a full set of raw data. This allows you to dive deeper into the details and work with the data in a way that best suits your needs.
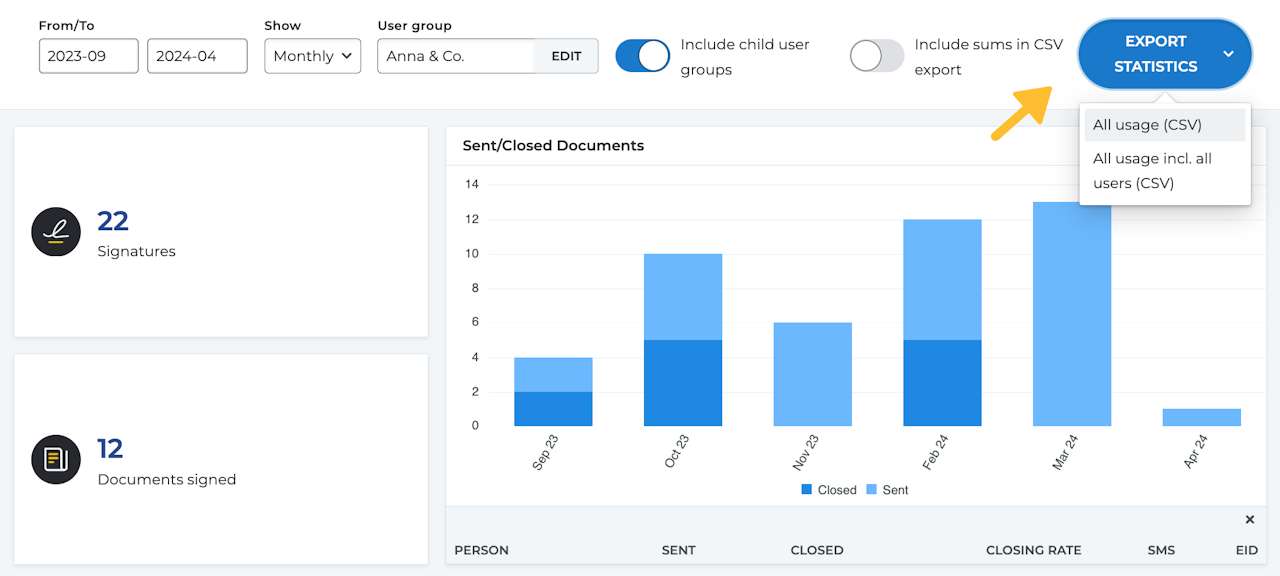
At the top right corner, you’ll find the option to download a comprehensive CSV file filled with statistics. You have two download options:
All usage (CSV): This file includes statistics for all active users during the set time period.
All usage including all users (CSV): This file contains statistics for all users, including inactive ones.

Interpreting exported data
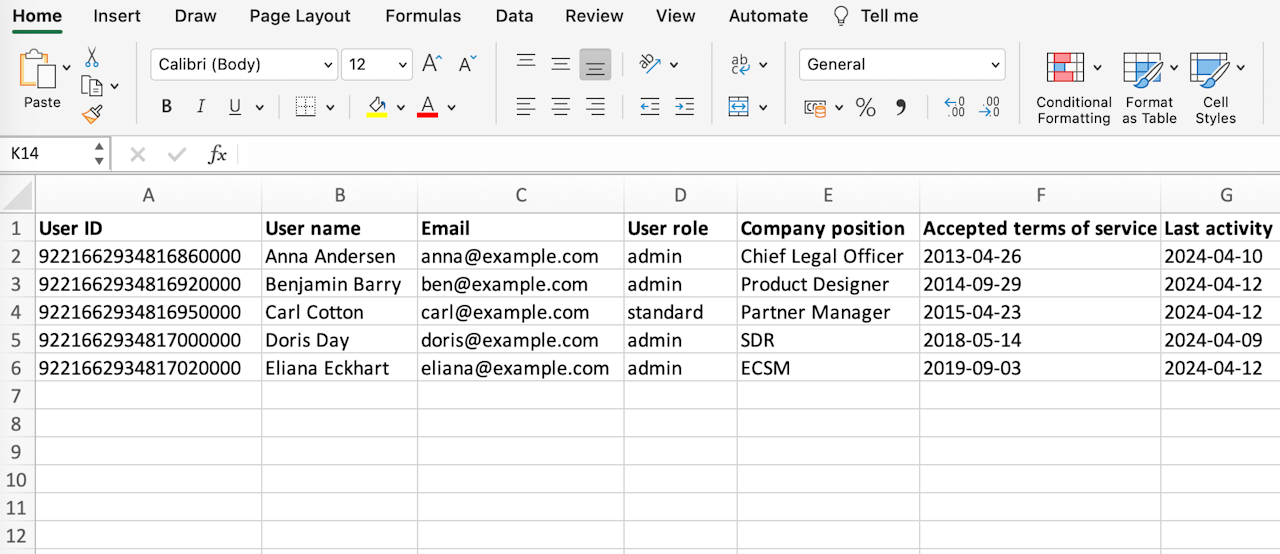
Once you’ve downloaded your CSV file, you can import it into a reader of your choice, such as Microsoft Excel.
User ID: Every user has a unique ID in Scrive.
Accepted terms of service: Whether the terms of service have been accepted and when, indicates when the user created their account.
Last activity: Captures any activity performed by the user, such as logging in to the service, updating settings, sending documents etc.
Last closed document: The most recent time a document was closed by all parties involved.
Sent: The total number of documents sent for signing.
Closed: The total number of documents closed, meaning all signatories in the process have signed.
Signatures: The total number of signatures in a single document.
Shareable links: The total number of shareable links, if purchased and used.
Columns eID (Column Q to BS): These columns provides full insight into the eIDs used, such as BankID, MitID and/or other eIDs that have been purchased.

Creating a pivot table
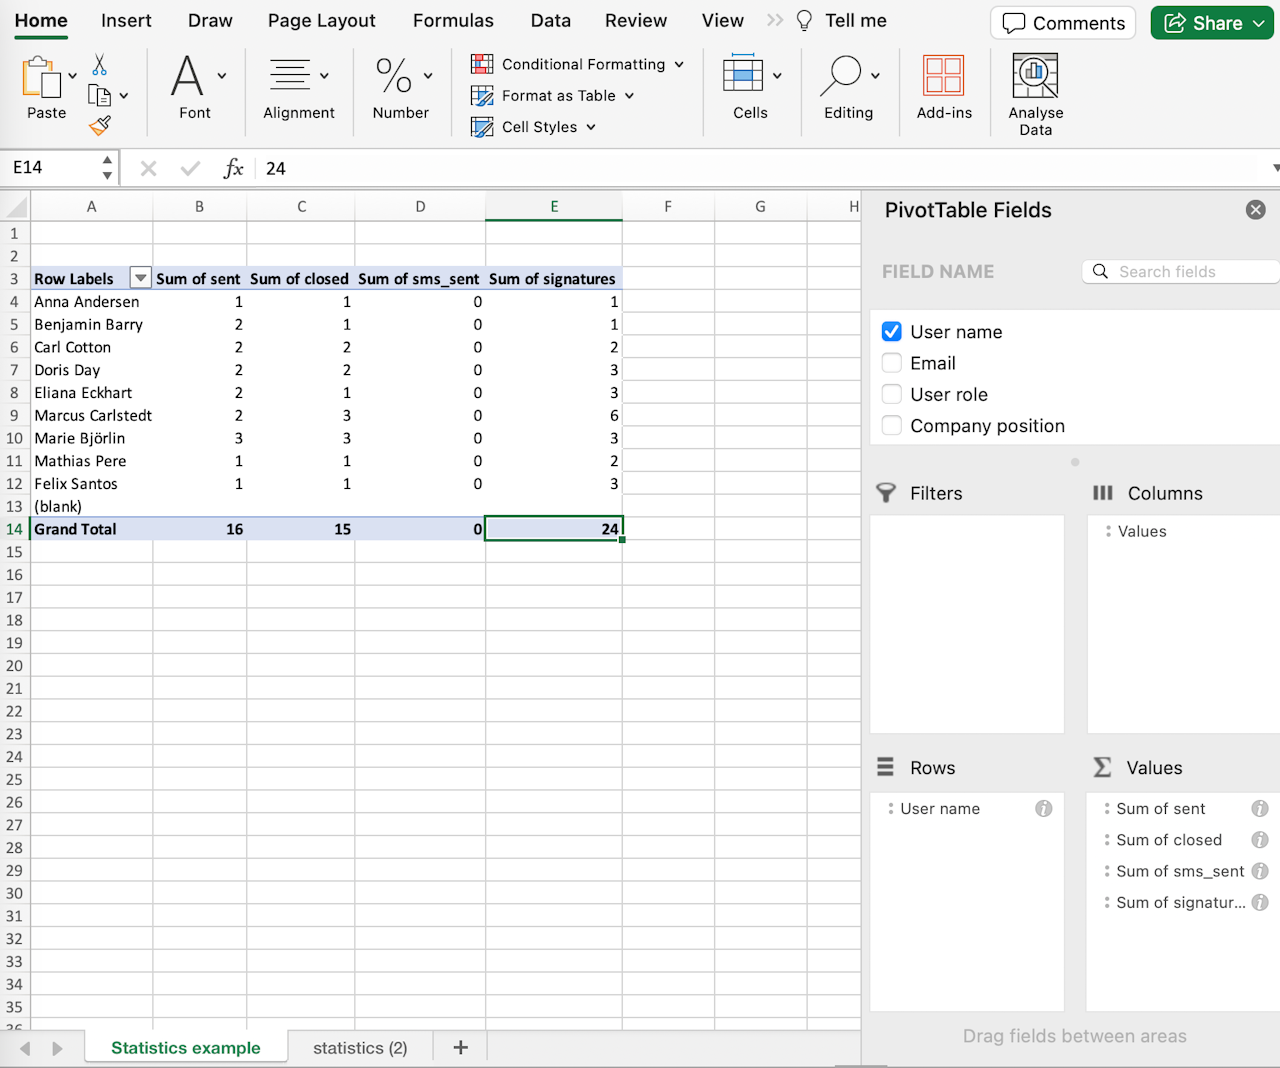
After importing your file into Microsoft Excel, you'll notice multiple columns and rows. While you can simply scroll through to read, it may become a little overwhelming if you have a lot of data in front of you. To make things easier, we recommend setting up a pivot table to better organise and compare your data.
To create a pivot table, follow these steps:
Select all your data by clicking the top left corner of your data sheet, or by pressing Ctrl+A on your keyboard.
Navigate to 'Insert' > 'Pivot Table', and then click 'OK'. A new sheet will open featuring your pivot table.
On the right, you can now drag and drop your selected values into either the rows or columns to start comparing your data.
We suggest starting by dragging either 'Email' or 'User name' to Rows, which will arrange all your users neatly. Then, simply drag the data you wish to analyse into the columns.
